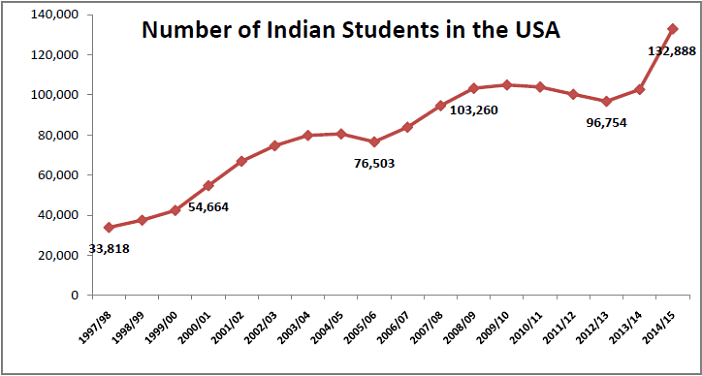
Indian students in the United States over the years:
| Year | Number |
| 2014/15 | 132,888 |
| 2013/14 | 102,673 |
| 2012/13 | 96,754 |
| 2011/12 | 100,270 |
| 2010/11 | 103,895 |
| 2009/10 | 105,000 |
| 2008/09 | 103,260 |
| 2007/08 | 103,000 |
| 2006/07 | 83,833 |
| 2005/06 | 76,503 |
| 2004/05 | 80,466 |
| 2003/04 | 79,736 |
| 2002/03 | 74,603 |
| 2001/02 | 66,836 |
| 2000/01 | 54,664 |
| 1999/00 | 42,337 |
Ranking of International students to the United States (Top 10 countries)
| Rank | Place of Origin | 2012/13 | 2013/14 | 2014/15 | 2014/15 % of total |
| World Total | 764,495 | 819,644 | 974,926 | 100.0 | |
| 1 | China | 235,597 | 274,439 | 304,040 | 31.2 |
| 2 | India | 96,754 | 102,673 | 132,888 | 13.6 |
| 3 | South Korea | 70,627 | 68,047 | 63,710 | 6.5 |
| 4 | Saudi Arabia | 44,566 | 53,919 | 59,945 | 6.1 |
| 5 | Canada | 27,357 | 28,304 | 27,240 | 2.8 |
| 6 | Taiwan | 21,867 | 21,266 | 20,993 | 2.4 |
| 7 | Japan | 19,568 | 19,344 | 19,064 | 2.0 |
| 8 | Vietnam | 16,098 | 16,579 | 18,722 | 1.9 |
| 9 | Mexico | 14,199 | 14,799 | 17,052 | 1.7 |
| 10 | Brazil | 10,868 | 13,286 | 23,675 | 2.4 |
The following is a ranking of American Universities in order of enrolled International students, 2013/14
| Rank | University | Number |
| 1 | New York University | (11,164) |
| 2 | University of Southern California | (10,932) |
| 3 | University of Illinois at Urbana-Champaign | (10,843) |
| 4 | Columbia University | (10,486) |
| 5 | Purdue University Main Campus | (9,988) |
| 6 | University of California - Los Angeles | (9,579) |
| 7 | Northeastern University | (9,078) |
| 8 | Arizona State University | (8,683) |
| 9 | Michigan State University | (7,704) |
| 10 | University of Washington | (7,469) |
The following is a ranking of American States in order of enrolled International students, 2013/14
| Rank | State | 2013/14 | 2014/15 |
| 1 | California | (121,647) | (135,000) |
| 2 | New York | (98,906) | (107,000) |
| 3 | Texas | (64,277) | (76,000) |
| 4 | Massachusetts | (51,240) | (55,000) |
| 5 | Illinois | (42,527) | (47,000) |
| 6 | Pennsylvania | (41,446) | (46,000) |
| 7 | Florida | (36,249) | (39,000) |
| 8 | Ohio | (32,498) | (36,000) |
The following is a ranking of American cities in order of enrolled International students (data from 2001-2002)
| Rank | Metropolitan Area | Number |
| 1 | New York | (35,737) |
| 2 | Los Angeles / Long Beach | (28,573) |
| 3 | Boston | (24,117) |
| 4 | Washington D.C | (21,727) |
| 5 | Chicago | (16,170) |
| 6 | Philadelphia | (11,002) |
| 7 | Houston | (10,561) |
| 8 | Dallas | (9,390) |
| 9 | San Jose | (9,250) |
| 10 | San Francisco | (8,375) |
Total number of international students from all places of origin by field of study:
| Rank | Field of Study | Number of Students | Percent of Total |
| 1 | Business and Management | 197,258 | 20.2% |
| 2 | Engineering | 196,750 | 20.2% |
| 3 | Other/Unspecified Subject Areas | 131,332 | 13.5% |
| 4 | Mathematics and Computer Sciences | 112,950 | 11.6% |
| 5 | Social Sciences | 75,951 | 7.8% |
| 6 | Physical and Life Sciences | 73,838 | 7.6% |
| 7 | Humanities | 66,737 | 6.8% |
| 8 | Fine and Applied Arts | 56,758 | 5.8% |
| 9 | Health Professions | 33,399 | 3.4% |
| 10 | Education | 17,675 | 1.8% |
| 11 | Agriculture | 12,278 | 1.3% |